Debug QEMU with GDB
Preface
Recently I was writing a 32-bit kernel with zig, it is so useful, and when I develop it, I meet some situations where I need to use debugger. But now, zig doesn’t have official debugger.
I tried bochs and qemu separately, Finally decided to use qemu.
Qemu can debug with GDB remotely.
Debug
My system is wsl archlinux, and I install qemu-full and gdb.
Here we only talk about how to debug. I will write a separate article to explain the relationship between operating system design.
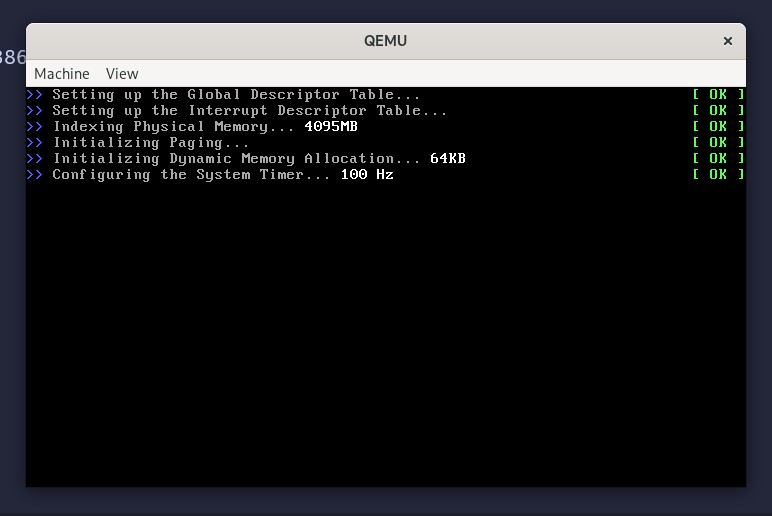
First, start qemu
we should start qemu, we can choose to start graphical or non-graphical
for examle:
qemu-system-x86_64 -kernel ./kernel -initrd ./rootfs.img -append "nokaslr console=ttyS0" -s -S -nographic
The parameters of the command line are as follows:
- -kernel ./kernel: start the specified elf kernel image
- -initrd ./rootfs.img: in-memory file system started
- -append “nokaslr console=ttyS0”: additional parameters, “nokaslr” must be added to prevent randomization of the kernel start address, which will cause gdb breakpoints to fail to hit
- -s: default listen on port 1234
- -S: hang after startup, waiting for gdb connection
- -nographic: no graph start
Second, start gdb
After we start qemu, it will wait for the gdb connection
now, we should input gdb in terminal, like this:
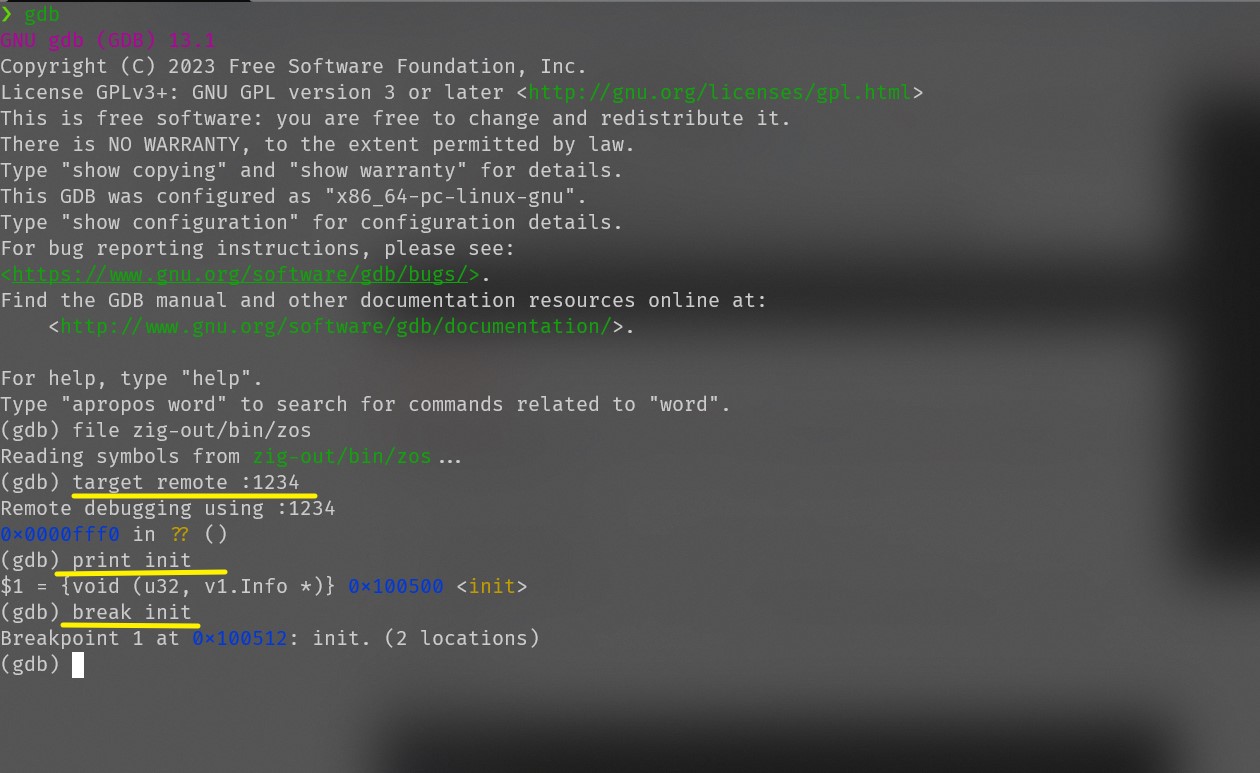
[linux]$ gdb
(gdb) file zig-out/bin/zos      # file read the symbol table of kernel
(gdb) target remote :1234
(gdb) break init                # breakpoint, break and hbreak all ok
(gdb) c   						# start debug, kernel will stop at init